

When Mercury Analytics and PSB Insights asked 409 car owners the standard satisfaction question, every brand looked like a winner. Jeep Wrangler, Tesla Model 3, Toyota Camry, Volkswagen Tiguan: all four scored high on top box satisfaction, all four had plenty of promoters, and all four had owners who said they would buy again.
But anyone who has driven a Wrangler and a Tiguan back to back knows those are not the same ownership experience. While the scores could not tell them apart, the owners’ own stories could.
This is the second post on our Jeep Happiness Study. The first asked whether Jeep owners are happier. This post examines what the same data says about measuring customer experience, and about what a Net Promoter Score leaves out.
What is the ceiling effect in customer satisfaction research?
The ceiling effect is what happens when most of your respondents choose the top of the scale. Once everyone is a 9 or a 10, the scale has stopped measuring anything. The passionate fan and the mildly content owner have given you the same answer, and you cannot see the difference between them. It shows up in NPS, in satisfaction top box scores, and in repurchase intent, and in this study it showed up in all three.
PSB’s answer was to go back to the stories. For each owner, the team scored the open-ended answers for satisfaction, likelihood to recommend, and repurchase intent, the same things the rating questions had asked about. Then it added a stricter level, which the team calls “top box plus”: is this person extremely satisfied, a passionate recommender, almost certain to buy again? At that level the four brands pulled apart in a way the rating scales never managed.
How can you measure NPS without asking the NPS question?
Rob Kaiser, Ph.D., is Chief Methodologist at PSB Insights and describes himself as a quant guy with psychology training. He wants numbers he can count on, repeat, and model, and he does not think a rating scale is the best place to get them.
“I don’t need to ask somebody how likely they are to recommend,” he said. “Give me the answers to these questions we asked, and I’ll tell you how likely they are to recommend. I’ll put it on a scale using AI and my number is going to be more valid than their numbers.” His shorter version of the same argument: “Rating scales suck. Telling stories don’t.”
The stories came from MercuryIQ, Mercury’s AI interviewing tool, which asked three open-ended questions inside a 15-minute survey and followed up on each answer. PSB’s Narrative Intelligence method then scored every respondent on each dimension in three steps.
1. Presence. Is this dimension, say satisfaction, present in what the person said?
2. Intensity. If it is, does the language reach a higher threshold, such as extreme satisfaction?
3. Opposite pole. If it is absent, is the negative version there instead, such as active frustration?
Several independent AI models rated each story, so no single model’s reading decides a score, and researchers reviewed and locked the definitions before the final pass. What comes out is a number per dimension per person, which can be joined back to the survey data and modeled like any other variable.
What did the stories reveal that the scores missed?
Different emotions for different brands, for a start. Joy showed up for most owners everywhere, though more for Jeep (85%) and Tesla (79%) than for Toyota (67%) or Volkswagen (59%). Excitement was where the field split. 43% of Tesla owners and 37% of Jeep owners showed it. 12% of Volkswagen owners did, and 6% of Toyota owners.
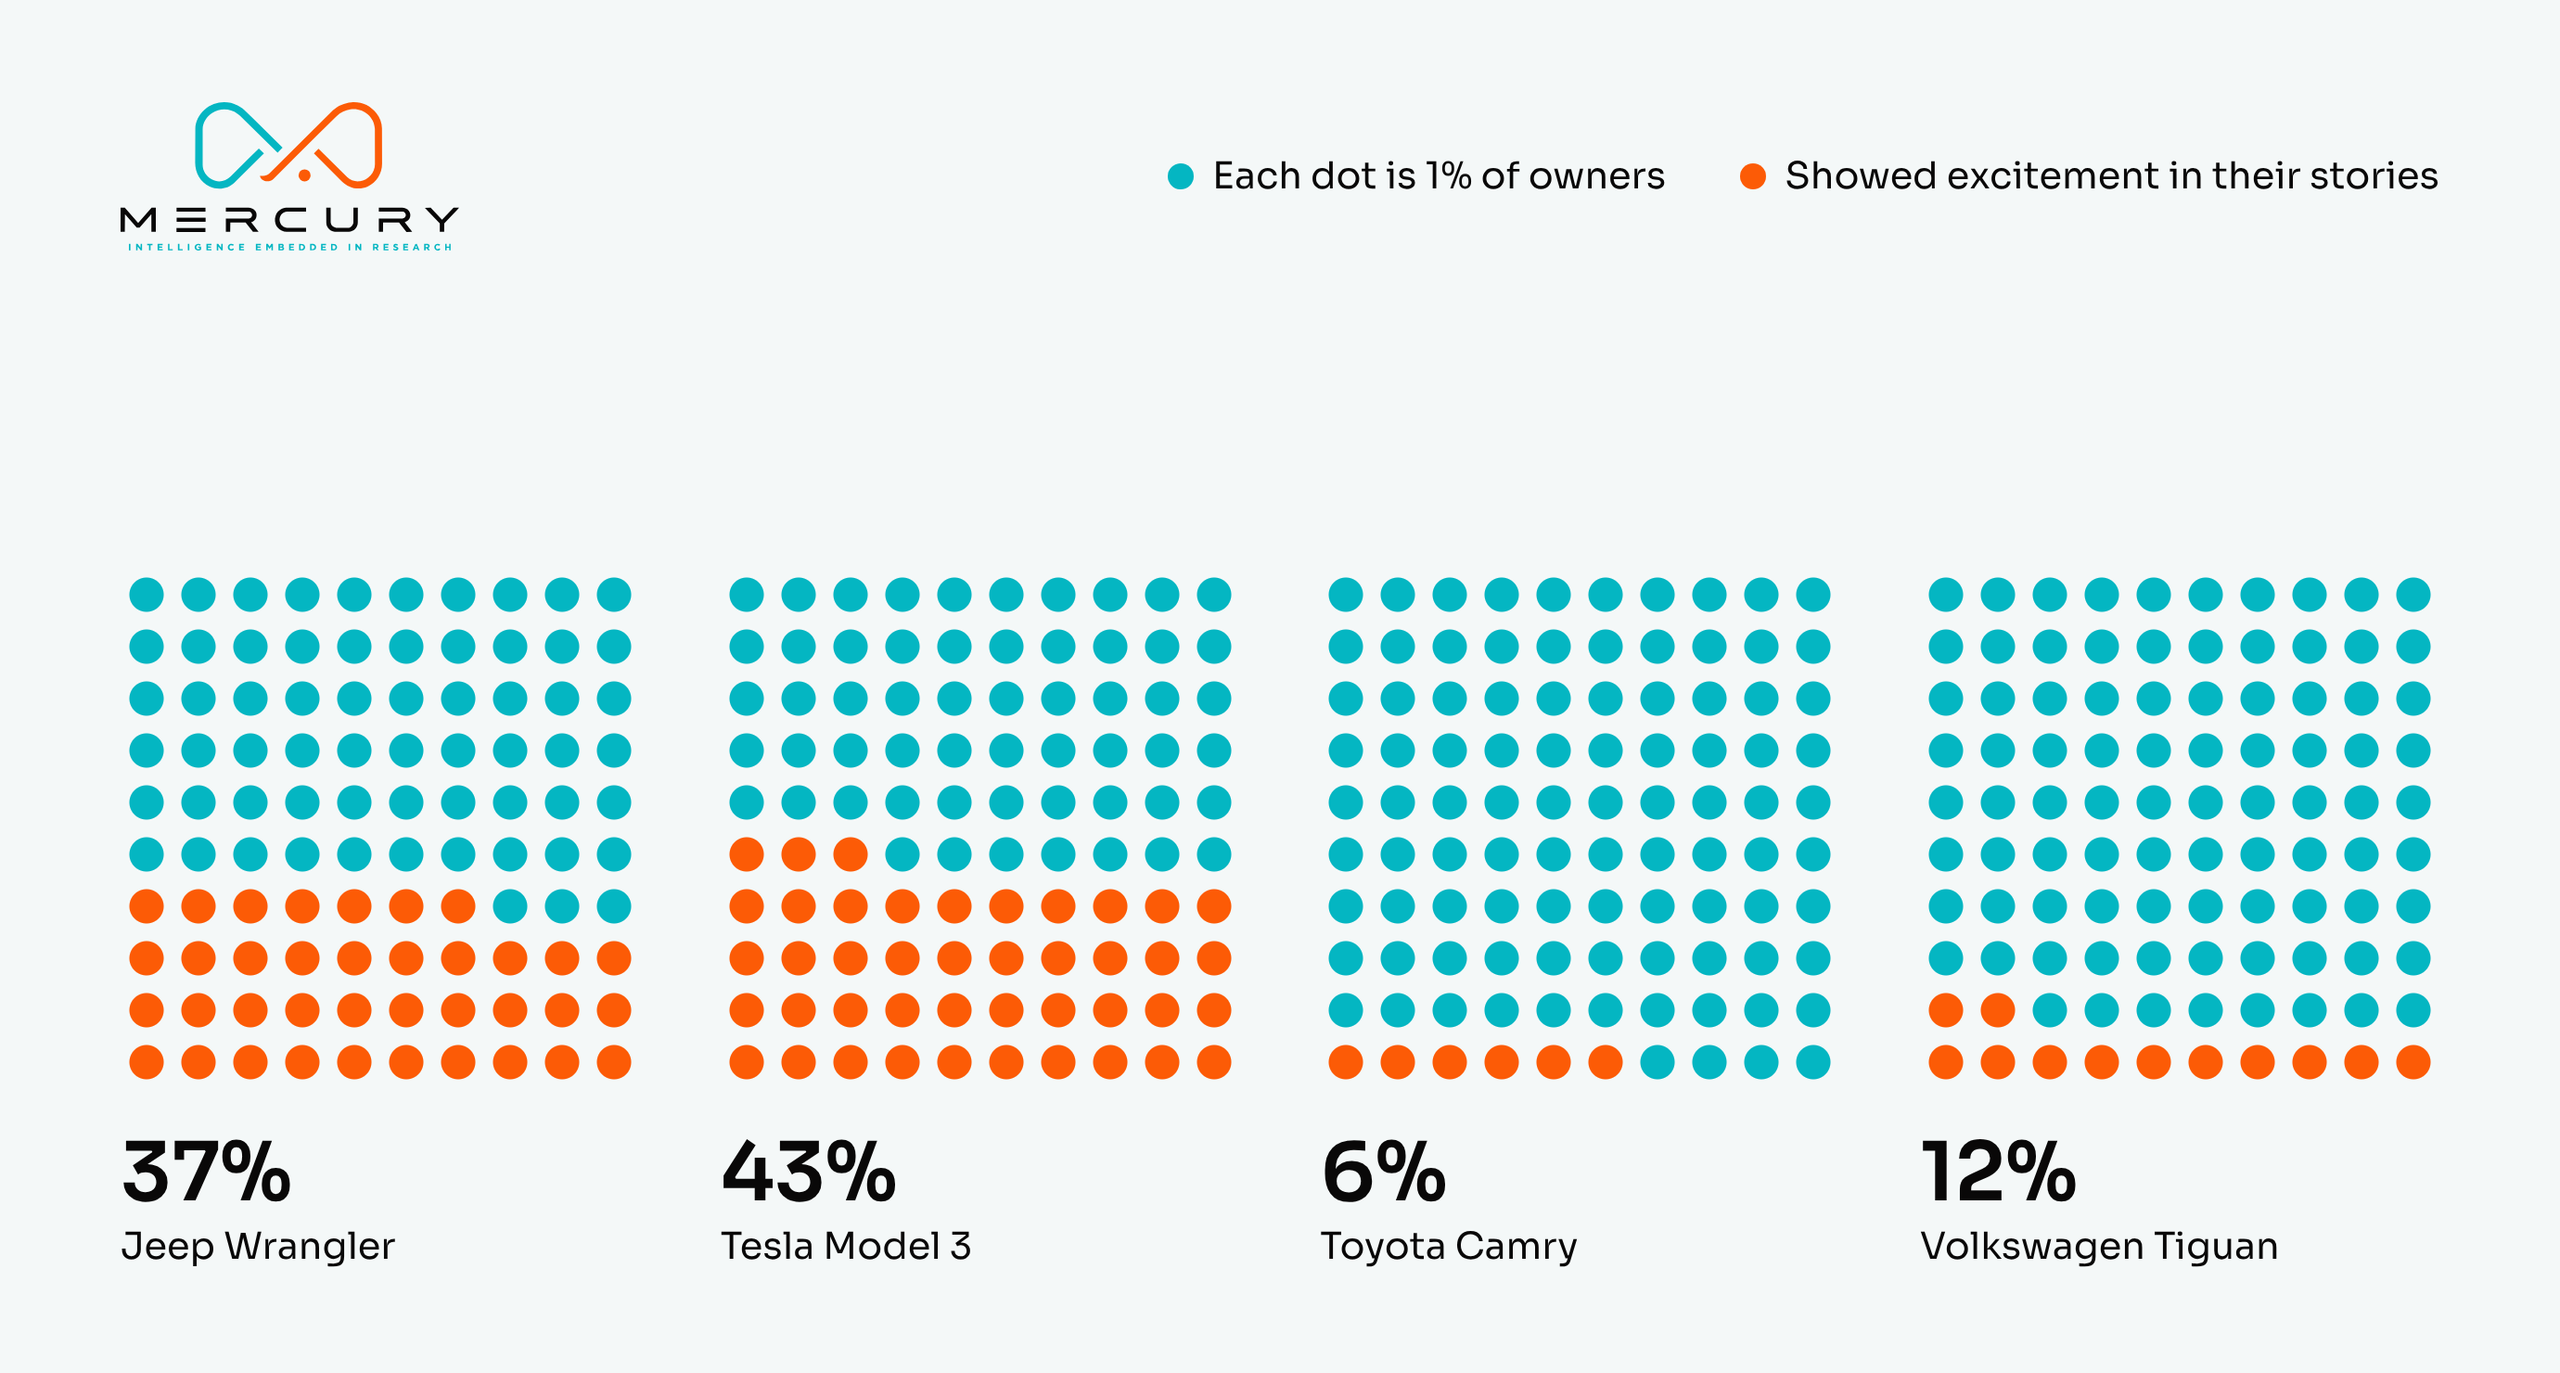
Source: Mercury Analytics and PSB Insights, Jeep Happiness Study, 2026. 409 US vehicle owners, weighted. Share of owners whose stories showed excitement: Tesla Model 3 43%, Jeep Wrangler 37%, Volkswagen Tiguan 12%, Toyota Camry 6%.
Toyota’s emotion was gratitude. 36% of Camry owners expressed it, nearly double any other brand, and nobody else in the study was thankful for their car in quite that way. Jeep alone combined respect (17%) and empowerment (16%) at more than double any competitor. Those are feelings about who you are, and nothing on the rating-scale side of the survey had asked about them.
What drives customer loyalty when everyone is satisfied?
Joy, mostly. PSB ran a regression predicting a combined customer experience outcome (satisfaction, promoter intent, and repurchase intent together) from the full set of scored dimensions, and joy came out as the strongest predictor, or tied for strongest, for all four brands.
What came second and third differed. For Jeep owners it was the car being life enhancing and the sense of community. For Tesla owners, value and community. Volkswagen’s model gave almost as much weight to owners feeling strong as to joy itself. As the paper puts it: “Same emotional engine, four different transmissions.”
Then the team turned the question around and modeled joy itself. For Toyota and Volkswagen owners, brand affinity came first: they are happy because they like the brand. For Jeep owners, brand affinity did not enter the model at all. Their joy came from the vehicle making life better and more adventurous, and the affection for the brand follows from that. A top two box score can tell you a customer is happy. It cannot tell you why.
When should a research team use this approach?
Wherever a score needs an explanation, which is to say almost always. Kaiser began with brand assessments and has since applied the method to NPS and satisfaction work, journey mapping with retailers, and creative testing. The dimensions look like the measures a tracker already produces, with the owner’s own words underneath each number.
It also means a study keeps paying off after fieldwork ends. “Let’s say an executive comes later and says, you measured the wrong thing,” Kaiser said. “Well, no, we didn’t. I got the stories. I can go score any dimension that makes sense, and we can go put that in a model to derive what’s driving things like likelihood to recommend.”
AI is the fast part. Leigh Kessler, VP of Client Solutions at Mercury Analytics, was the first to say that MercuryIQ got him to an answer quickly, and that the modeling is what took it from a quick read to something a brand could base a campaign or a large investment on. “It takes a researcher and an expert to really know what to do with it,” he said.
In this case, initially, the four brands all looked like winners. But Toyota’s score rests on reliability and gratitude, Tesla’s on technology and status, Volkswagen’s on comfort and the feeling of being strong, and Jeep’s on a life that got better. So, while the four top box scores said the same thing, there were actually four completely different reasons behind them, and none of those reasons shows up in a tracker. In fact, a tracker would have called it a tie. The stories said why each brand earned its score, and that is the part a brand can act on.
To add AI-guided open-ends to your next satisfaction or loyalty study, request a demo of MercuryIQ, or explore the Analytics Workbench.