

Yes, at least in the way they talk about their cars. When Mercury Analytics and PSB Insights asked 409 vehicle owners to write a letter to their car, 59% of the Jeep Wrangler owners wrote about fun and the joy of driving. Among Tesla Model 3 owners it was 41%. Toyota Camry and Volkswagen Tiguan owners came in at 18% and 17%.
This started as a hunch, and a fairly personal one. Leigh Kessler, VP of Client Solutions at Mercury Analytics, drives a Wrangler, runs an Instagram account called Doors Off Days, and has a Doors Off tattoo. It’s fair to say Kessler is pretty passionate about Jeeps, and is happier for owning one.
One thing he kept noticing was that the Jeep people he met seemed happier than other drivers, and he wanted to know whether that could be proven. Acknowledging his bias, he took the question to Rob Kaiser, Ph.D., Chief Methodologist at PSB Insights, who also drives a Wrangler and who happened to be looking for a customer experience project to test a new method on. The two of them presented the results at ESOMAR North America 2026 in Atlanta on November 4.
“I knew we had the technology to do it, something you definitely couldn’t have even done two years ago because of what AI has now allowed us to do,” Kessler said. “But what I needed was the methodology.”
How do you measure something as fuzzy as happiness?
Nobody in the study was asked to rate their happiness. The team asked for stories instead, then read those stories through Maslow’s Hierarchy of Needs, the five-level model Abraham Maslow set out in his 1943 paper “A Theory of Human Motivation.”
The logic goes like this. A story about a car that always starts and never breaks down is a story about safety, one of the basic needs near the bottom of Maslow’s pyramid. A story about the friends you made because of the car, or the person it lets you be, is about belonging, esteem, and self-actualization, the needs at the top. The more of an owner’s stories live at the top, the closer that owner is to what most people would recognize as happiness.
A satisfied customer and a happy one can sound very different. The Camry owner who wrote “Dear Sweet Dependable Camry, I just thought I would express to you my gratitude for everything you do for me” is satisfied, and clearly so. Meanwhile, a Wrangler owner wrote about “cruising down the beach with the top down and the doors off” and “what life should be like, free and easy with the wind in your hair.” That describes something else.
How did the study combine qualitative and quantitative research?
Everything happened inside one 15-minute online survey, so each owner’s stories and their ratings came from the same person in the same sitting. The sample was 409 US owners after weighting, recruited through Dynata, Lucid, and Pure Spectrum and split almost evenly across Jeep (n=101, 96% of them Wranglers), Tesla Model 3 (n=101), Toyota Camry (n=100), and Volkswagen Tiguan (n=107).
After a few screener questions, every owner answered three open-ended prompts:
1. Write a letter to your vehicle. A love letter or a breakup letter, their choice.
2. Tell us about your most memorable moment with it.
3. If a friend was thinking of buying the same car, what would you tell them?
MercuryIQ, Mercury’s AI interviewing tool, read each answer as it arrived and asked follow-up questions, guided by a set of key concepts the researchers wanted it to probe. One Jeep owner, asked at the end whether they would recommend their Jeep to others, added a caveat: “Last thing, the openness can be negative in the rain.” Only after the stories did the survey turn to the standard customer satisfaction questions, the kind you would find in any NPS tracker.
Kaiser, who describes himself as a quant guy with a psychology background, had a specific worry about AI follow-ups. “One of the things you learn when you’re doing these kinds of research is don’t irritate respondents,” he said. “You want to get a lot from them without irritating them.” But what he liked about MercuryIQ was that the probing adjusted to each answer instead of asking two questions and stopping.
The stories were then coded four ways. MercuryIQ had already tagged each one in real time against 15 themes the team set before fieldwork, things like brand loyalty, community engagement, and gaps between expectation and reality. MercuryAI then generated its own themes from what people had written, and coded every story a third time against Maslow’s hierarchy. Finally, PSB’s Narrative Intelligence method turned each respondent’s stories into scored dimensions that could be modeled like any rating-scale data.
What did Jeep owners say that other owners didn’t?
The letters are where the four groups stop looking alike. Camry and Tiguan owners wrote thank-you notes. They praised cars that start every morning, cost little to run, and transport the family without complaint, and the coding agrees: 70% of Toyota owners and 66% of Volkswagen owners were classed as practical utility seekers, the highest of any group.
Tesla owners wrote about technology and about being early to something. One described the first test drive as “almost like what I feel driving a cloud would feel like,” though 17% of Tesla owners also flagged a gap between what they expected and what they got.
Jeep owners are different; they wrote about themselves. Their letters are full of beaches, trails, doors off, tops down, and the people they have met because of the car. One owner, a Wrangler driver for 30 years, told the car “you are my happy place.” Another recalled the day the Jeep came home and the husband and kids who “looked so happy and proud for me,” and added that friends say “the Jeep matches your personality.” When MercuryAI coded the letters for themes, that difference turned into a number.
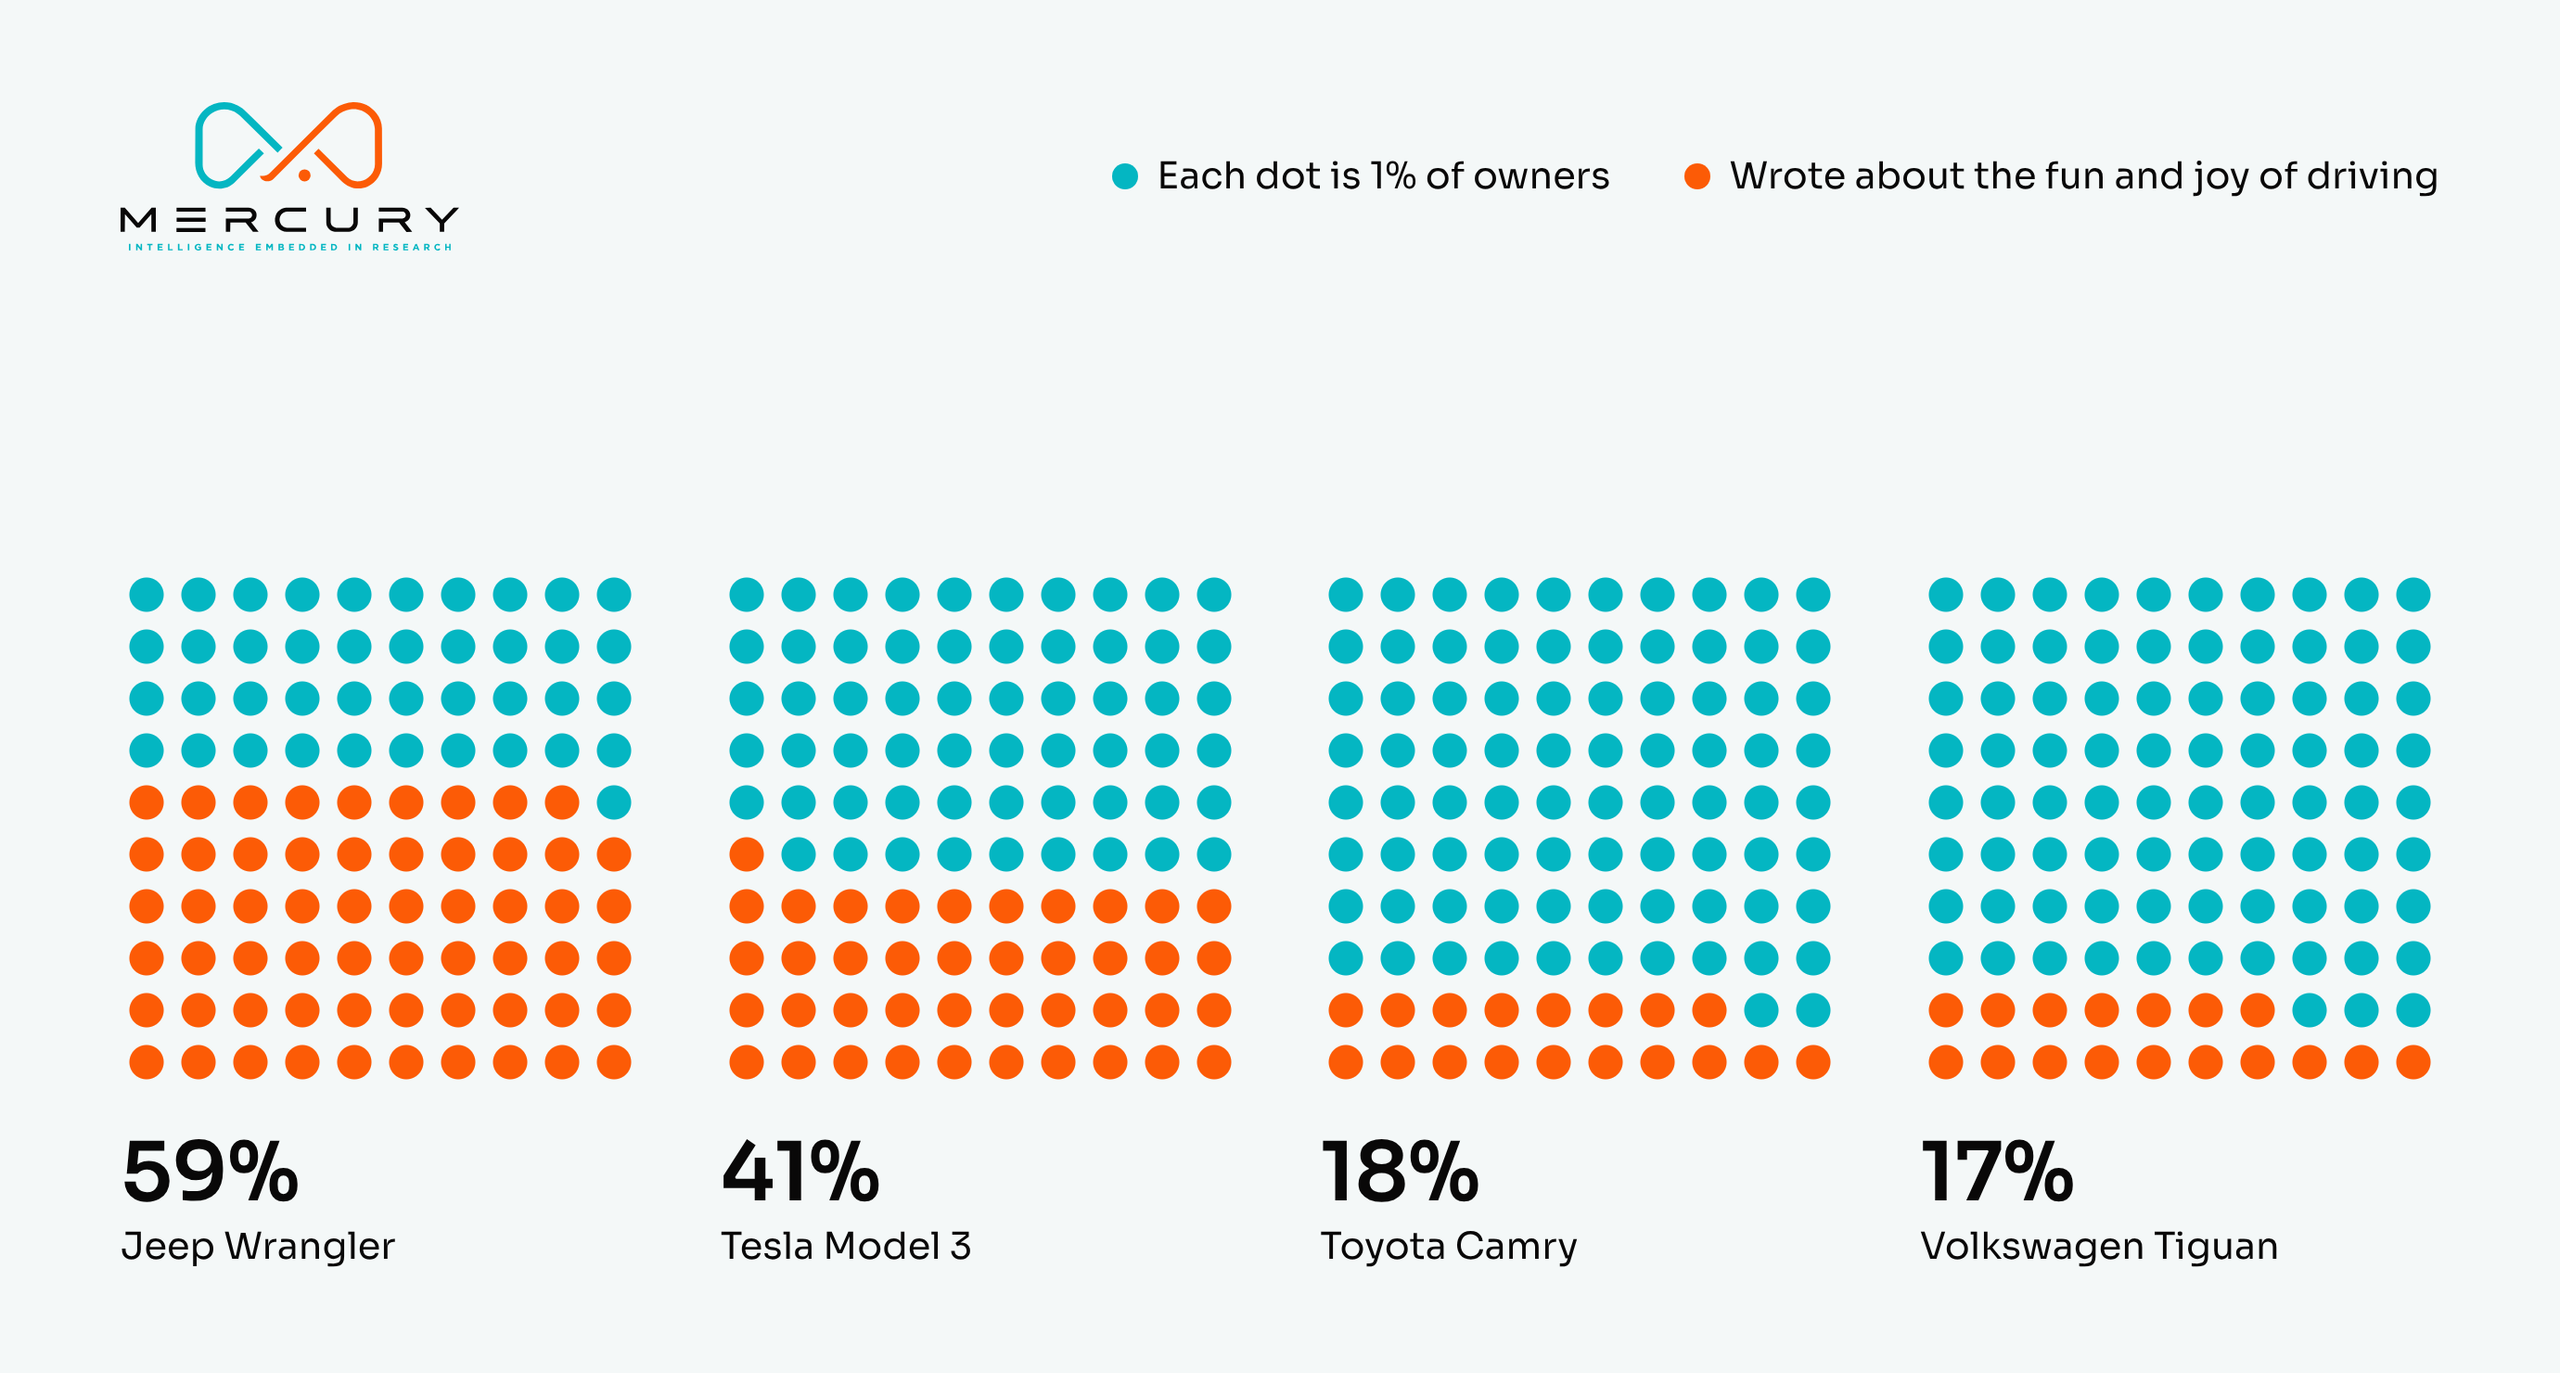
Source: Mercury Analytics and PSB Insights, Jeep Happiness Study, 2026. 409 US vehicle owners, weighted. Share of owners who wrote about the fun and joy of driving in a letter to their vehicle: Jeep Wrangler 59%, Tesla Model 3 41%, Toyota Camry 18%, Volkswagen Tiguan 17%.
Fun and joy was the biggest single gap, but three other coded themes separate Jeep owners from everyone else more sharply. Half of them were coded as lifestyle or identity aligners, against 23% of Tesla owners and 1% of Toyota and Volkswagen owners. A quarter were personalization or modification appreciators, and 16% were community or brand culture engaged. Those last two categories came in at zero for every other brand in the study.
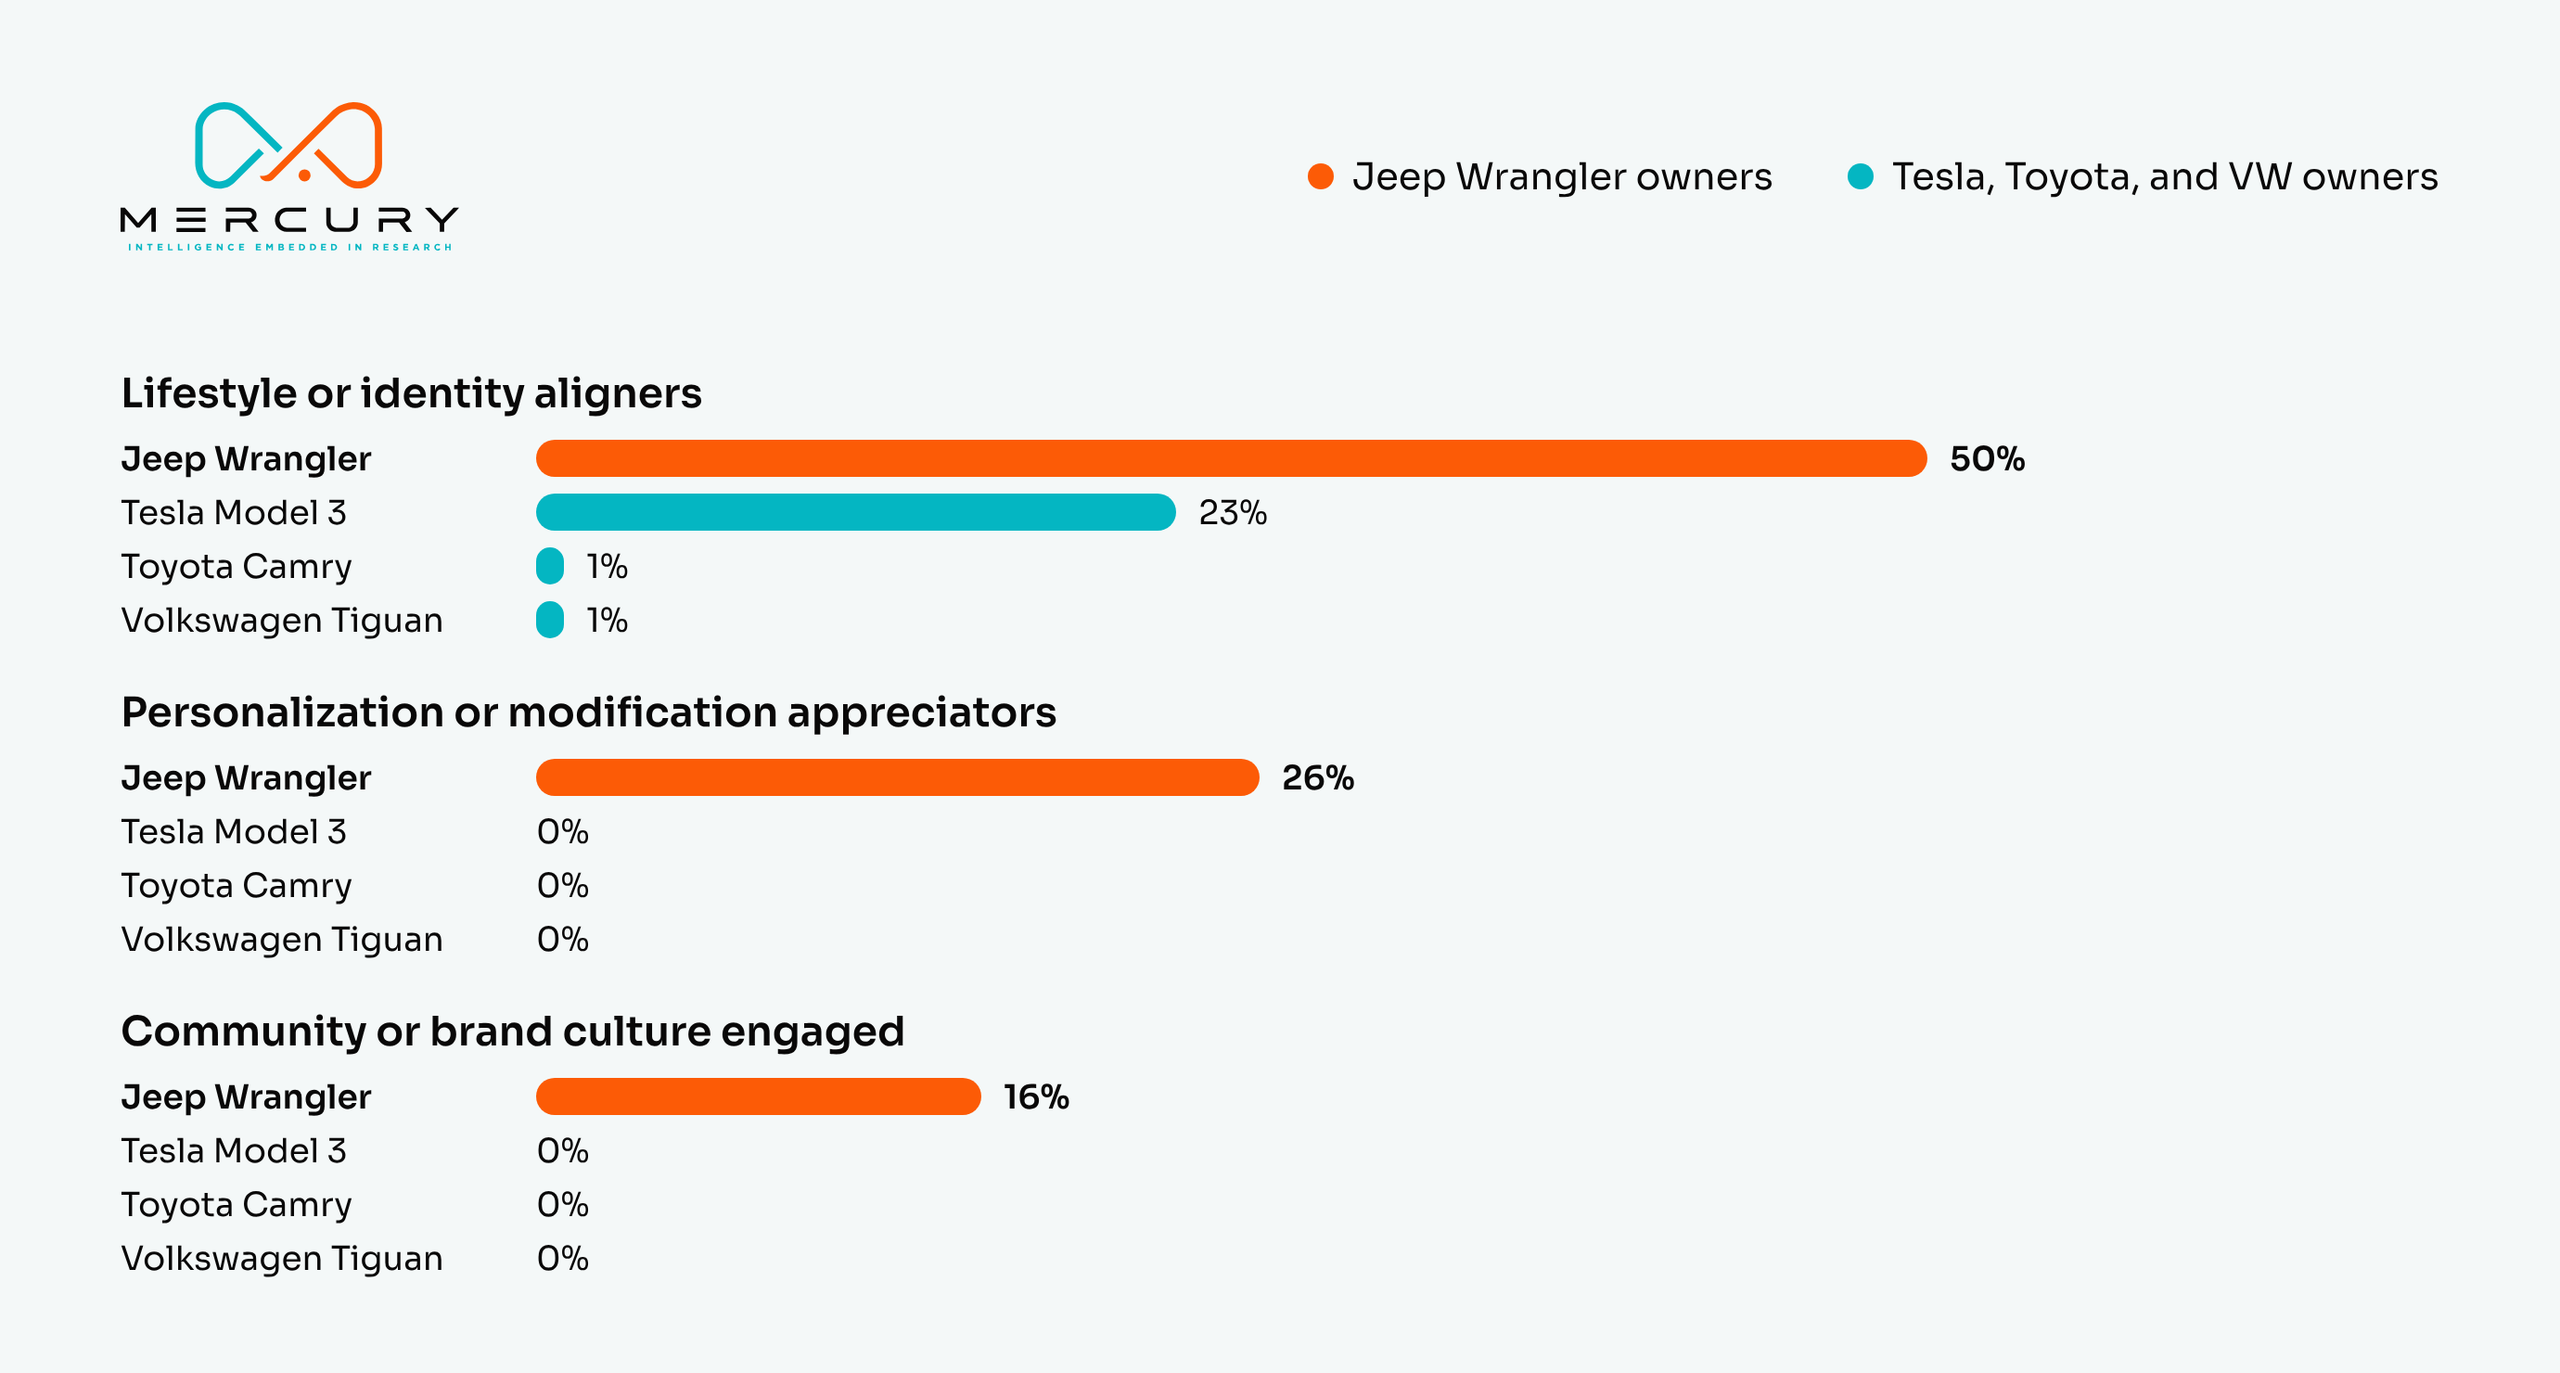
Source: Mercury Analytics and PSB Insights, Jeep Happiness Study, 2026. 409 US vehicle owners, weighted. Share of owners coded to each theme. Lifestyle or identity aligners: Jeep Wrangler 50%, Tesla Model 3 23%, Toyota Camry 1%, Volkswagen Tiguan 1%. Personalization or modification appreciators: Jeep Wrangler 26%, Tesla Model 3, Toyota Camry, and Volkswagen Tiguan 0%. Community or brand culture engaged: Jeep Wrangler 16%, Tesla Model 3, Toyota Camry, and Volkswagen Tiguan 0%.
The community numbers come straight out of Jeep culture. There is the Jeep Wave. There is ducking, where you leave a rubber duck on a stranger’s Jeep. One owner described meeting “a couple of random jeepers in a parking lot” who invited them to a meet and greet, driving back roads for an hour, and ending up at “a huge jeep jamboree where we stayed all day having an absolute blast, making great memories and new friends.” Another wrote: “I had no idea how excited I would get when I get ducked; I’m actually super unsociable and I have become way more sociable since getting the Jeep.”
On Maslow’s scale, that is love and belonging. Jeep owners also led on self-actualization, the top of the pyramid, which barely registered for Toyota or Volkswagen owners.
Are Jeep owners happier, or just more satisfied?
More satisfied, no. On the standard measures, Toyota won. 96% of Camry owners said they were very satisfied, against 89% of Jeep owners, and 89% of Camry owners were promoters on the NPS question, against 77% of Jeep owners. Jeep owners were also second only to Volkswagen owners in mentioning drawbacks, maintenance costs, or problems when advising a friend, at 41%. If this had been an ordinary satisfaction tracker, Toyota would have come first and the Jeep story would never have surfaced.
That is the point of the study. Satisfaction measures whether a product does what you bought it to do. The Camry does, and its owners are grateful. Happiness, at least as it showed up in these stories, is about whether the thing has a place in your life beyond its job, and the complaints Jeep owners made about rain and maintenance bills did nothing to dent the group’s scores on the upper tiers of Maslow’s hierarchy.
Both authors are careful about what the study can and cannot say. Every story was about a vehicle, so the findings describe happiness as expressed through car ownership, not happiness in general. And people who buy Wranglers may be happier to begin with. Asked about that during an October preview of the session, Kessler didn’t argue. “I say it’s the latter,” he said, “but it is fulfilled through the former.” Kaiser agreed.
What does this mean for brands?
Nothing about the method is specific to cars. Kaiser has used the same approach on customer experience work, brand assessments, journey mapping with retailers, and creative testing, anywhere a client needs the why behind a score. Because the stories are kept, the analysis also outlives the original brief. “I got the stories,” Kaiser said. “I can go score any dimension that makes sense.” A team can come back months later with a new question and answer it from the same data without fielding another survey.
Part two of this story, on what the same data says about Net Promoter Scores, follows next week. Watch the ESOMAR presentation here and request a demo to see how MercuryIQ adds AI-guided open-ends to a survey,